

Custom Concentration Meter Build Guide for Precise Lab Measurements
2026-10-31
If you've ever squinted at a lab instrument and wished it actually matched your measurement needs, this guide is for you. Precise concentration readings shouldn't depend on generic, one-size-fits-all meters. We're building a custom concentration meter from the ground up—covering the sensor choices, calibration steps, and circuit tweaks that make your data trustworthy. Along the way, you'll see why Sinou components keep showing up in reliable lab setups. Ready to stop guessing and start measuring? Let's get into the build.
Why a DIY Concentration Meter Makes Sense for Serious Labs
Most commercial concentration meters come locked into fixed wavelengths and narrow path lengths, which rarely line up with what a specialized lab actually needs. When you build your own, the optical geometry, light source, and detection range become choices you make based on the samples you handle every day, not compromises dictated by a catalog. That kind of control often translates directly into better signal-to-noise ratios and fewer workarounds when dealing with turbid or highly absorbing solutions.
There is also a quiet economic logic that goes beyond the initial price tag. A DIY unit lets you swap in a better LED or a more sensitive photodiode when your requirements shift, instead of buying a whole new instrument. For labs that run uncommon assays or need to log data into custom software, being able to adjust the firmware and readout format on your own schedule removes a dependency that can quietly stall research.
Perhaps the most underrated benefit is familiarity. When something drifts or gives an odd reading, you will know exactly which part to check because you assembled the optical path yourself. That troubleshooting speed, paired with the ability to document calibration steps in your own terms, makes a DIY concentration meter less of a hobby project and more of a practical instrument for a working lab.
Selecting the Detector for Stability Rather Than Peak Specs
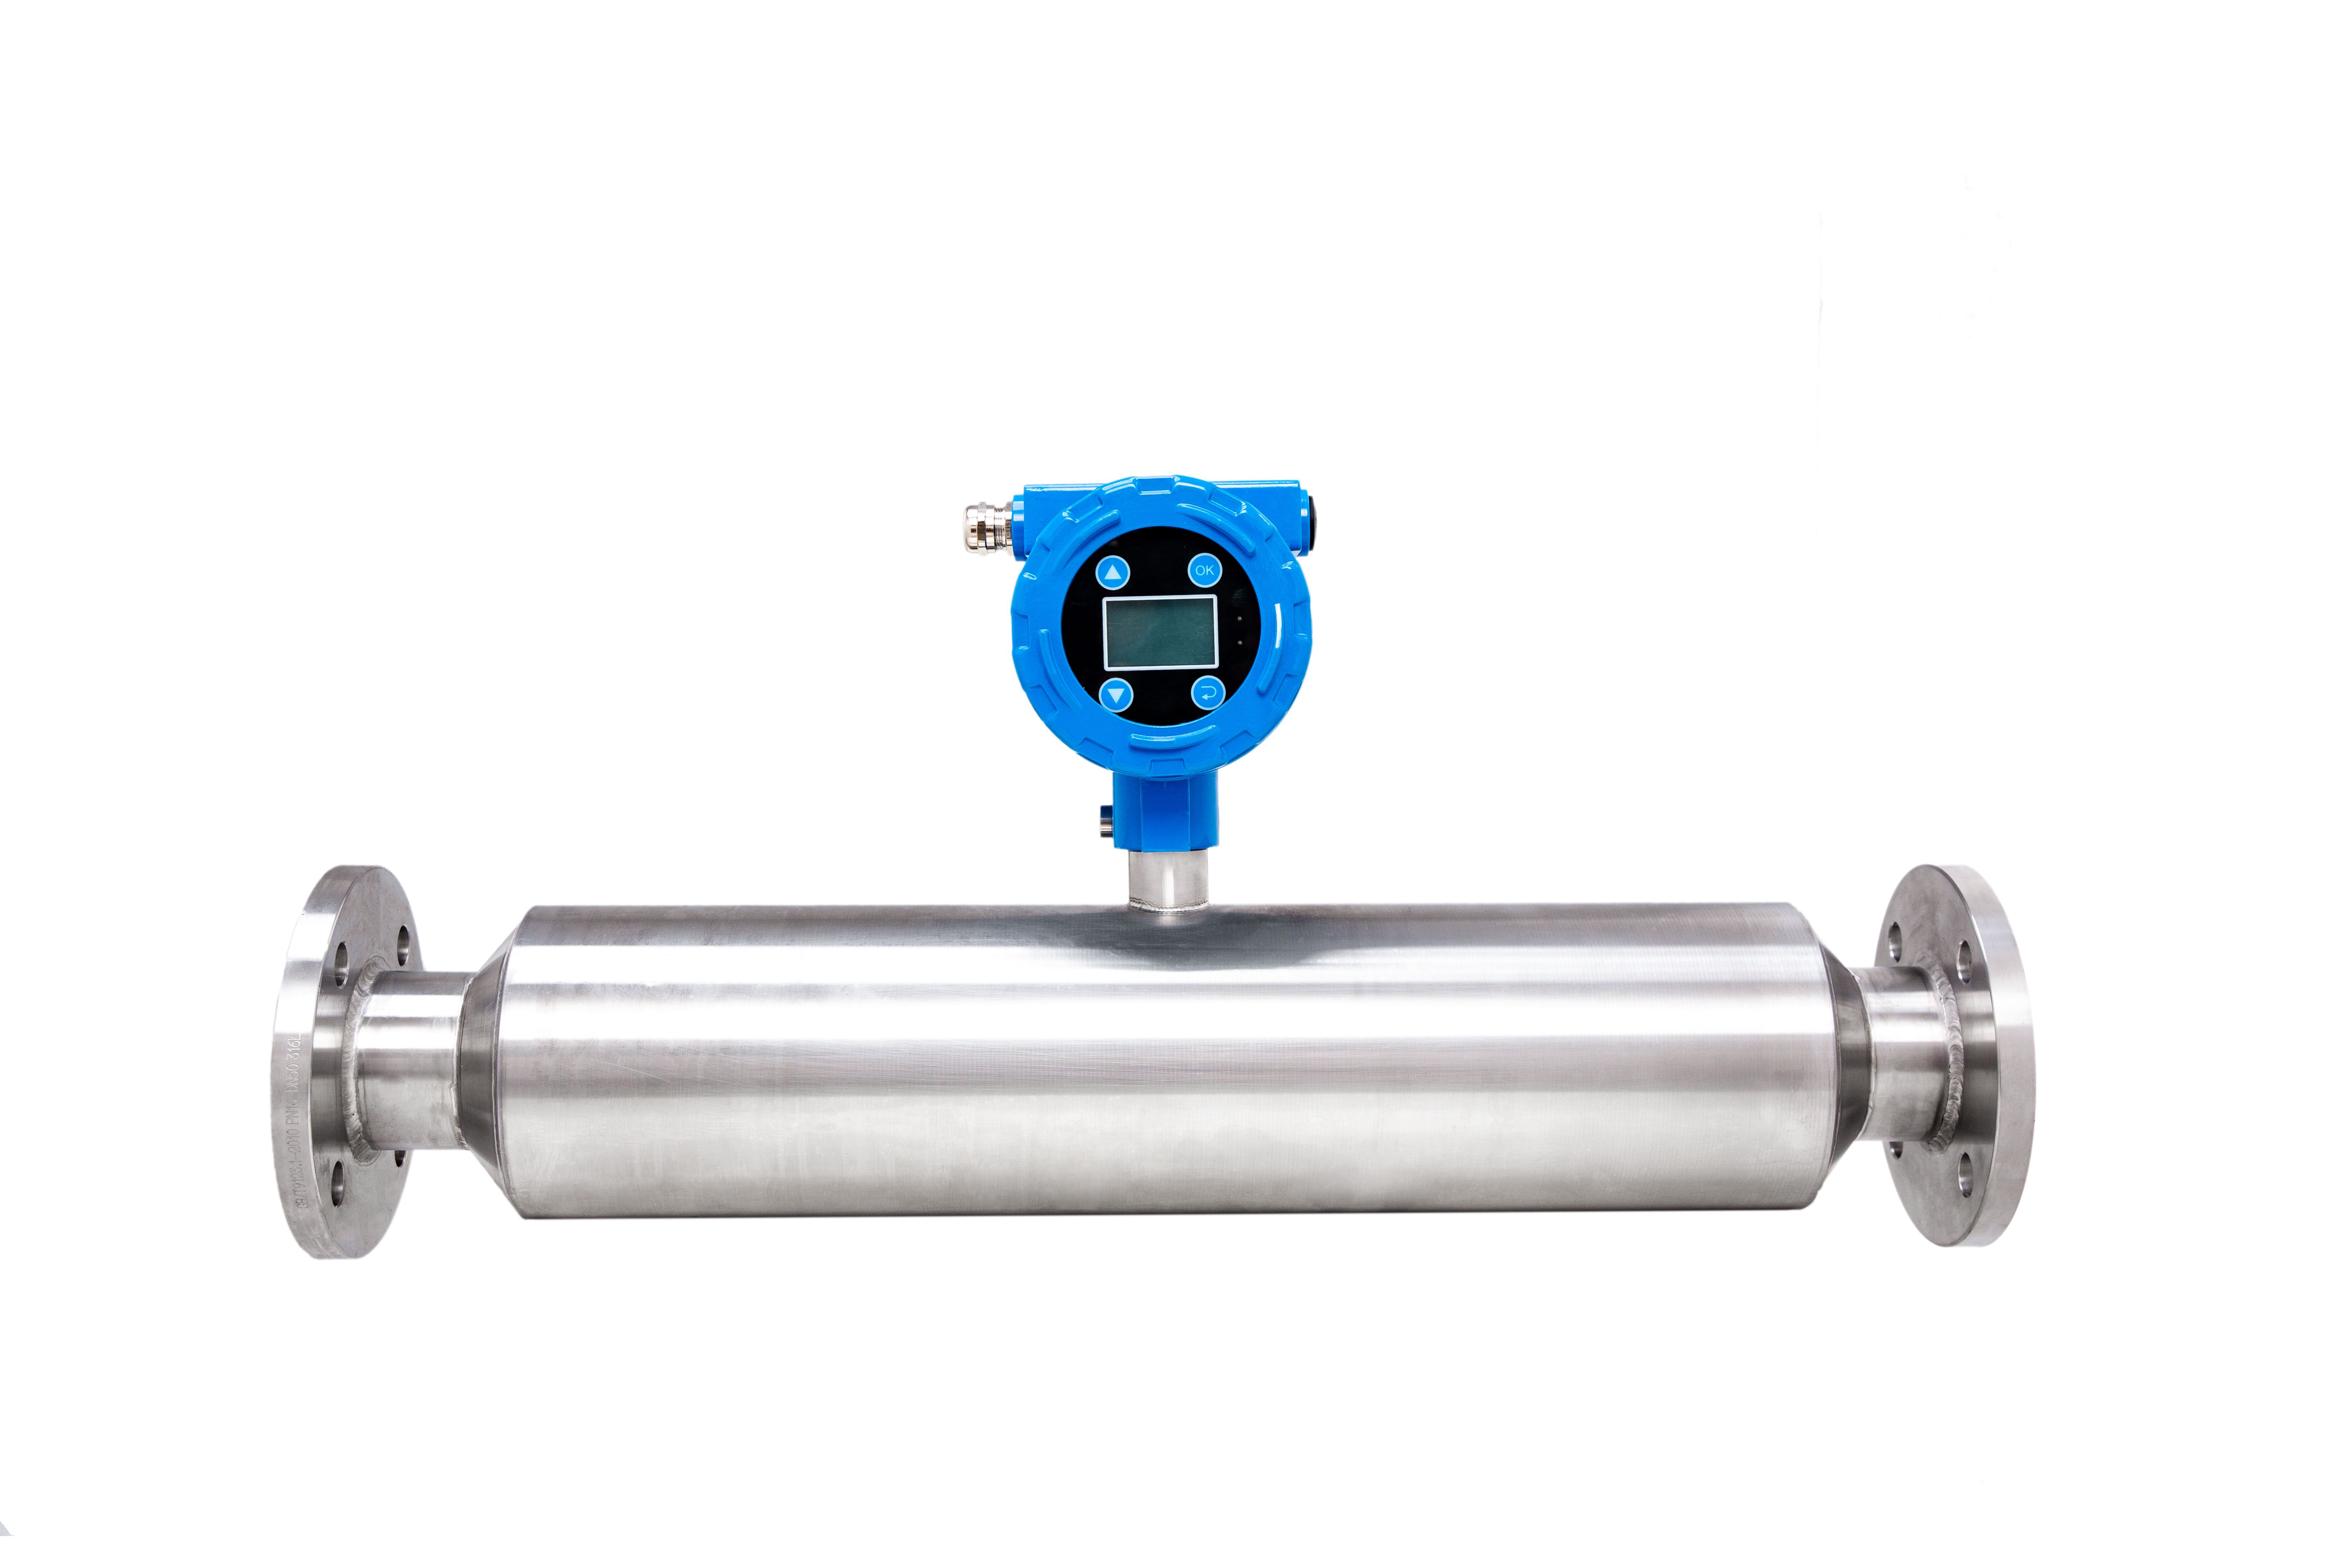
When scanning a detector's datasheet, it's tempting to fixate on headline numbers like maximum sensitivity or widest linear range. But those figures are usually captured under tightly controlled conditions that rarely match daily lab work. What actually determines long-term performance is how steadily the detector behaves over hours and days—low baseline drift, consistent noise, and minimal need for recalibration. A device with slightly lower peak specs but rock-solid stability will deliver more trustworthy quantitative results than one that occasionally dazzles but wanders between injections.
In routine analysis, the hidden cost of instability shows up as frequent standard re-runs, method tweaking, and troubleshooting. A detector that holds a steady response across temperature shifts, solvent gradients, and real samples saves far more time than a nominally more sensitive unit that demands constant attention. Stability also protects method transfer between instruments and operators, reducing the risk of unexplained deviations when a colleague repeats your protocol.
Before committing to a purchase, ask for long-term noise and drift plots rather than just a single injection's peak height. Better yet, run a known sample repeatedly over several days and watch how the baseline behaves. A stable detector under imperfect conditions will outperform an unstable one with perfect specs every time, especially when you're dealing with complex matrices or low-concentration analytes where small fluctuations can erase a peak entirely.
Taming the Analog Front End to Keep Baseline Wander at Bay
Baseline wander rarely comes from a single, tidy source. Electrode half-cell potentials drift with temperature and sweat, motion artifacts flex the skin and disturb charge distribution, and nearby power lines sneak in through capacitive coupling. A front end that treats these as static offsets misses the point: the baseline is a moving target, and the analog chain must track it without erasing the signal of interest.
The usual fix is a high-pass corner set low enough to pass the desired waveform but high enough to reject slow wander—yet a single passive RC often leaves either residual wander or phase distortion near the corner. A more effective approach is to wrap a slow integrator around the input stage, creating a first-order servo that actively cancels DC and sub-hertz drift. The integrator's time constant becomes the dominant knob; set it too fast and you chew into the low-frequency ECG or strain-gauge content, set it too slow and the output drifts for seconds after a lead-off event.
Practical front ends combine the servo with a fast-settling clamp or a switched reset that fires only when the amplifier rails or a comparator detects gross overload. This gives the best of both worlds: the servo handles normal drift without user intervention, while the reset pulls the baseline back within range after a saturating artifact. Resistor choices matter more than most datasheets admit—large feedback resistors add thermal noise and leakage paths, so designers often use T-networks or active inductor emulation to keep values manageable. The result is a front end that stays locked to the signal's true baseline even when the environment tries to push it around.
Calibration Curves That Reflect Your Actual Chemistry, Not a Generic Template
A calibration curve only earns its place in a notebook when it mirrors the exact solution conditions your samples actually face. That means matching the diluent, salt load, pH, and even the lot of matrix you are working with instead of borrowing a neat solvent-based series from another project. When you force a generic template onto a method, the intercept and slope may look acceptable on paper, but they quietly drift once real extracts, quenching agents, or co-eluting interferences enter the picture.
Building the curve from your own freshly prepared standards in the same background as your unknowns lets you see where the detector responds linearly and where it starts to flatten or scatter. It also exposes day-to-day shifts in ionization or lamp output before they become a failed sequence. For trace-level work, weighting the fit and checking residuals at the low end often reveal whether your lowest standard is truly above the noise or simply propping up an optimistic R².
The goal is not a perfect-looking line but a curve you can defend from injection to injection. When the chemistry changes—new sample prep, a different column, a revised extraction volume—the curve should change with it. Treating calibration as a live reflection of your current method, rather than a reusable template, is what keeps quantification honest and repeatable.
Shielding the Optical Path from Ambient Light and Vibration
A stable optical path demands more than just precise alignment—it requires a deliberate effort to isolate the beam from two often-overlooked disruptors: stray light and mechanical vibration. Ambient light sneaks in through seams, reflections off nearby surfaces, or even the glow of indicator LEDs, and it can wash out weak signals or introduce false readings. A practical fix is to use baffled enclosures with matte-black internal surfaces, combined with narrowband optical filters that only pass the wavelength of interest. This creates a dark, quiet channel where photons travel without competing noise.
Vibration is a different beast. It doesn't just blur the image; it shifts the entire optical axis in tiny, unpredictable ways. Fans, foot traffic, and even acoustic noise from nearby equipment can excite resonances in mounts and breadboards. Rather than relying on a single heavy base, a layered approach works best: place the most sensitive components on kinematic mounts with low natural frequencies, use viscoelastic damping pads under the breadboard, and route cables through strain-relief loops so they don't act as vibrating strings. The goal is to break the mechanical path before it reaches the optics.
One often-neglected detail is the interface between the enclosure and the outside world. A light-tight box that still rattles at certain frequencies undoes half the work. Sealing edges with closed-cell foam gaskets that also serve as vibration dampers, and mounting the entire assembly on isolation feet tuned below the dominant disturbance frequency, can transform a finicky setup into one that stays aligned for hours. In the end, shielding the optical path is less about buying expensive hardware and more about understanding where the energy—whether as photons or as motion—finds a way in.
Testing Against Certified Standards Before You Trust a Single Reading
A measurement is only as trustworthy as the yardstick behind it. When precision matters, raw instrument output rarely tells the whole story. Certified reference materials, round-robin interlaboratory comparisons, and traceable calibration chains exist precisely because a single unverified number can slip past even experienced eyes. Before accepting any reading, ask what standard was applied to validate it, and whether that standard itself has been independently challenged.
Blind trust in a device's display or a quick lab report overlooks how drift, contamination, and operator bias quietly distort results. Certified standards act like an external conscience: they force a comparison against a known truth rather than an assumption. If a gauge reads 10.02 but the certified block measures 10.00, that 0.02 gap is not an error to ignore, it is a prompt to recalibrate. Skipping this step turns every subsequent decision into a guess dressed up as data.
Practical routines help here. Keep a log of standard checks, not just final values. Rotate reference materials so one flawed lot cannot silently anchor your whole process. And when a reading seems too clean or too convenient, run the standard again before celebrating. Consistency with a certified reference does not guarantee truth, but inconsistency with one is an early warning you cannot afford to dismiss.
FAQ
A stable light source, a cuvette holder with a fixed path length, a photodiode or phototransistor for detection, a microcontroller with an analog-to-digital converter, and a way to display or log readings. Adding a temperature sensor helps compensate for drift, and an adjustable gain stage gives you more control over sensitivity.
Prepare at least five known standard solutions covering the expected range. Measure each one, plot the response against concentration, and fit a curve rather than assuming a straight line. Recheck the calibration at the start of every session and whenever you change the light source, cuvette, or sample matrix.
It is usually built for absorbance, where the detector sits directly opposite the light source. For fluorescence you need a different geometry, typically a 90-degree detector, plus excitation and emission filters. It is possible to adapt the design, but expect extra alignment work and background signal from stray excitation light.
Bubbles in the cuvette, thermal drift, stray light leaking into the detector, and noisy analog readings are the biggest issues. Degas or gently tap samples before measuring, enclose the light path, let the electronics warm up, and use shielded cables with a low-pass filter on the ADC input.
Use an open-source microcontroller board and stream readings as plain text over USB serial. A small Python script can capture the stream and save it as a CSV file. If a computer is not available, write to a microSD card in a simple delimited format that any spreadsheet program can open.
You can get close enough for many teaching, field, or process control applications if you choose components carefully and control temperature. However, matching a benchtop research instrument is unlikely because those devices use precise monochromators, stable lamps, and tightly matched detectors that are hard to replicate at low cost.
If you use an ultraviolet or laser light source, wear appropriate eye protection and keep the beam enclosed. Handle chemical standards and samples according to their safety data sheets, avoid spills near the electronics, and double-check all wiring before applying power.
Look up the analyte's absorbance spectrum in a reference database or published method. Select an LED, laser diode, or filtered lamp with a narrow emission peak close to that wavelength. If your analyte has a broad peak, a wider-band source with a simple optical filter may still give acceptable results.
Conclusion
A custom concentration meter may seem like an unnecessary detour when commercial units sit ready to order, but serious labs quickly find that off-the-shelf devices rarely match the drift, noise, and linearity requirements of exacting chemical work. Building your own forces you to select a photodetector for long-term stability rather than a glossy peak sensitivity number—because a detector that wanders by a few millivolts an hour will corrupt every reading, no matter how sensitive it looks on paper. The analog front end deserves just as much attention. Guard traces, clean split-supply grounding, and a low-leakage input stage keep baseline wander from masquerading as concentration shifts. If the baseline breathes with lab temperature or nearby equipment, no amount of software correction will fully rescue the data.
Once the electronics settle, calibration becomes the real differentiator. A generic polynomial from a datasheet won't survive contact with your actual matrix, pH, or solvent background; you need standards prepared in the same medium you'll measure. That means spiking known concentrations into your own blank, not someone else's buffer. The optical path also needs mechanical and optical isolation—blackened baffles, a rigid mount, and maybe a modest shield around the cuvette to stop stray light and micro-vibrations from turning a stable absorbance into a noisy one. Finally, before trusting any field sample, run the finished meter against certified reference materials across the range you care about. If the residuals don't look random or the low-end points sit above your limit of quantitation, go back to the front end or the light source. That loop—build, shield, calibrate, verify—is what turns a collection of parts into an instrument you can actually defend in a lab notebook.
Contact Us
Contact Person: HaiYan
Email: [email protected]
Tel/WhatsApp: +86 18957325588
Website: https://www.senyoubeton.com/